After your dataset has been processed in ROCK Desktop, a new folder named "processed" will be created in the original folder. Within the new "processed" folder there will be an HTML file named "processing_report."

Double clicking on this file will open it in a web browser for further inspection. The first section of the processing report will provide general information about the dataset, hardware used for data collection, base station data used for the PPK workflow, device firmware, processing settings, and more.

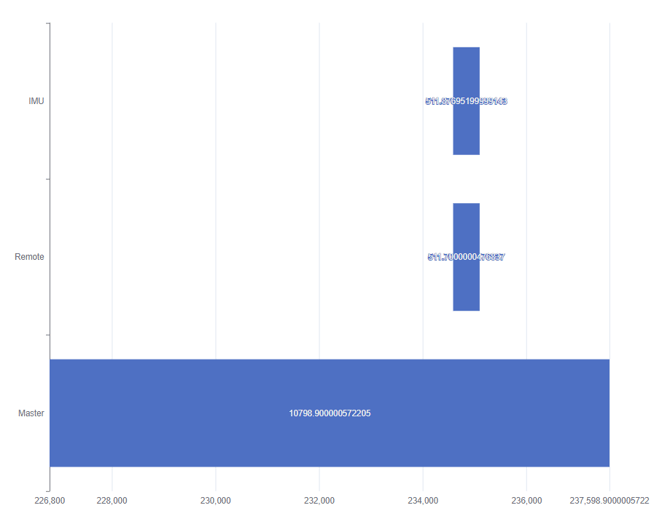
Below the general information will be a plot that shows the overlap between the base station data (master) and the GNSS of LiDAR unit (IMU and remote). You want to see the base station data present before, during, and after the GNSS of LiDAR data. The X-axis of the plot is showing GPS time in seconds.
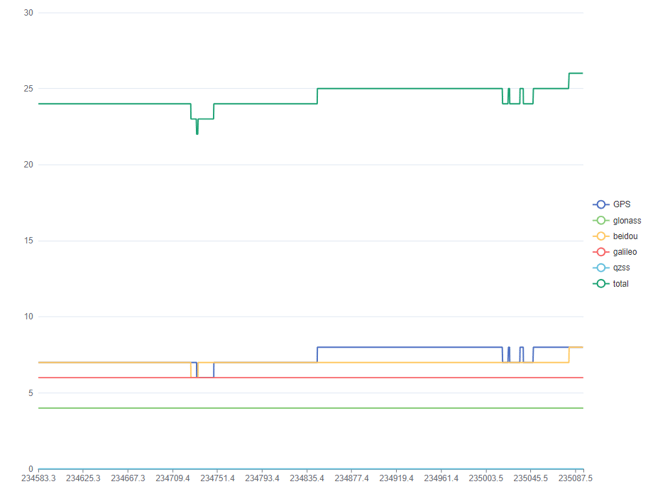
The next three plots can be insightful for understanding the processed data. The plot of satellites used in GNSS solutions shows the number of satellites used from each constellation during data capture. It can be used to ensure satellite coverage is available from satellite constellations during capture. If coverage from a constellation is missing, this could be an indication that your base station was not collecting data. If there is a sudden drop in number of satellites, this could be an indication that signal was lost (going under a bridge, tree, etc.). If the plot shows 4 different satellite constellations and 22-32 total satellites for the duration of the flight, then that would indicate high quality data being collected. The X-axis of the plot is showing GPS time in seconds for the duration of LiDAR data collection.
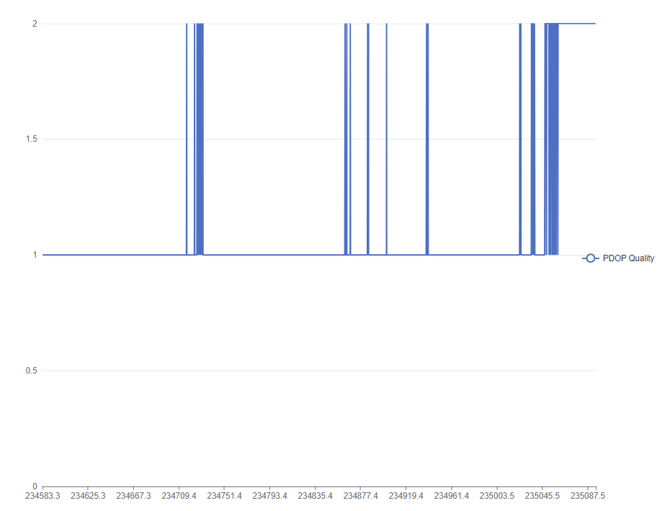
The plot of GNSS Quality indicates the strength and distribution of the GNSS satellite geometry. The lower the number the better the signal. If the PDOP is greater than 3, it typically indicates a poorer connection/distribution of the satellites and can cause issues and would indicate that another base station should be used. The X-axis of the plot is showing GPS time in seconds for the duration of LiDAR data collection. If the plot is showing PDOP Quality spikes for smaller periods of time that is not as concerning as observing the PDOP Quality being greater than 3 for extended periods of time.
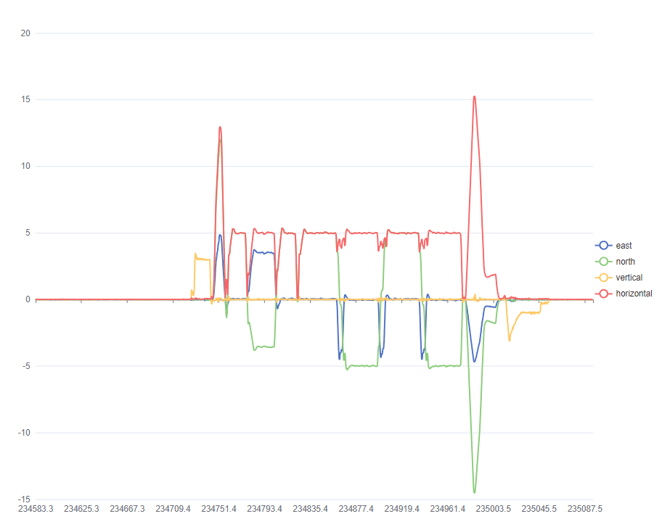
The plot of GNSS Velocity helps indicate whether calibration maneuvers were performed. Typically, there should be a spike at the beginning and the end of graphs indicating the required high speed calibration. This plot is also helpful to see if the horizontal speed of the drone exceeded 3 meters per second after the final high speed kinematic calibration flight was flown. Further, it helps to indicate any anomaly that could have occurred during flight that may or may not affect the results. The X-axis of the plot is showing GPS time in seconds for the duration of LiDAR data collection.
Other plots include Doppler Residuals which shows the doppler residuals for all the satellites in the solution. If there are large spikes, that is an indication that there could be a bad satellite, a general problem and/or that a different base station should be used. The Total Combined Attitude Separation plot shows the delta between forward and reverse solutions with respect to heading, pitch, and roll. Ideally, the solution for each is near 0. If there is a large delta, it could be an indication of a poor base station or insufficient calibration. The Estimated Attitude Accuracy plot shows the standard deviation computed in the GNSS/INS Kalman filter in terms of roll, pitch, and heading. Ideally, the values are close to 0. If there is a large delta, it could be an indication of a poor base station or insufficient calibration. The Total Combined Position Separation plots the delta between forward and reverse solutions for the north, east, and height positions. < br/>< br/> Large discrepancies (> 5cm) mid-flight (outside of takeoff and landing) could be an indication for further investigation and/or that verification of data is needed. If large discrepancies in the data exist, validate the base station used or try a different base station.
Strip Alignment Results (for process of ROCK Ultra Datasets)
If Strip Alignment was enabled during the final point cloud projection, the results below will be visible in the processing report. The images show the alignment error over the whole dataset; the darker colors indicate lower error, while the brighter colors indicate higher alignment error. In the Original Alignment image below, a higher error (blue) can be observed between the strips. In the Corrected Alignment image, the error is essentially removed ( black). If the error between strips does not improve between the Original and Corrected Alignment, it could indicate an issue with the Strip Alignment process.
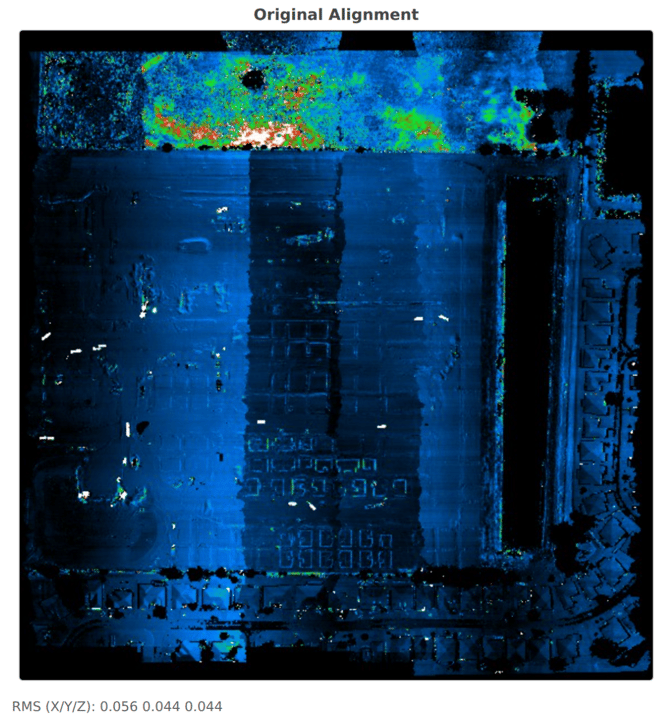
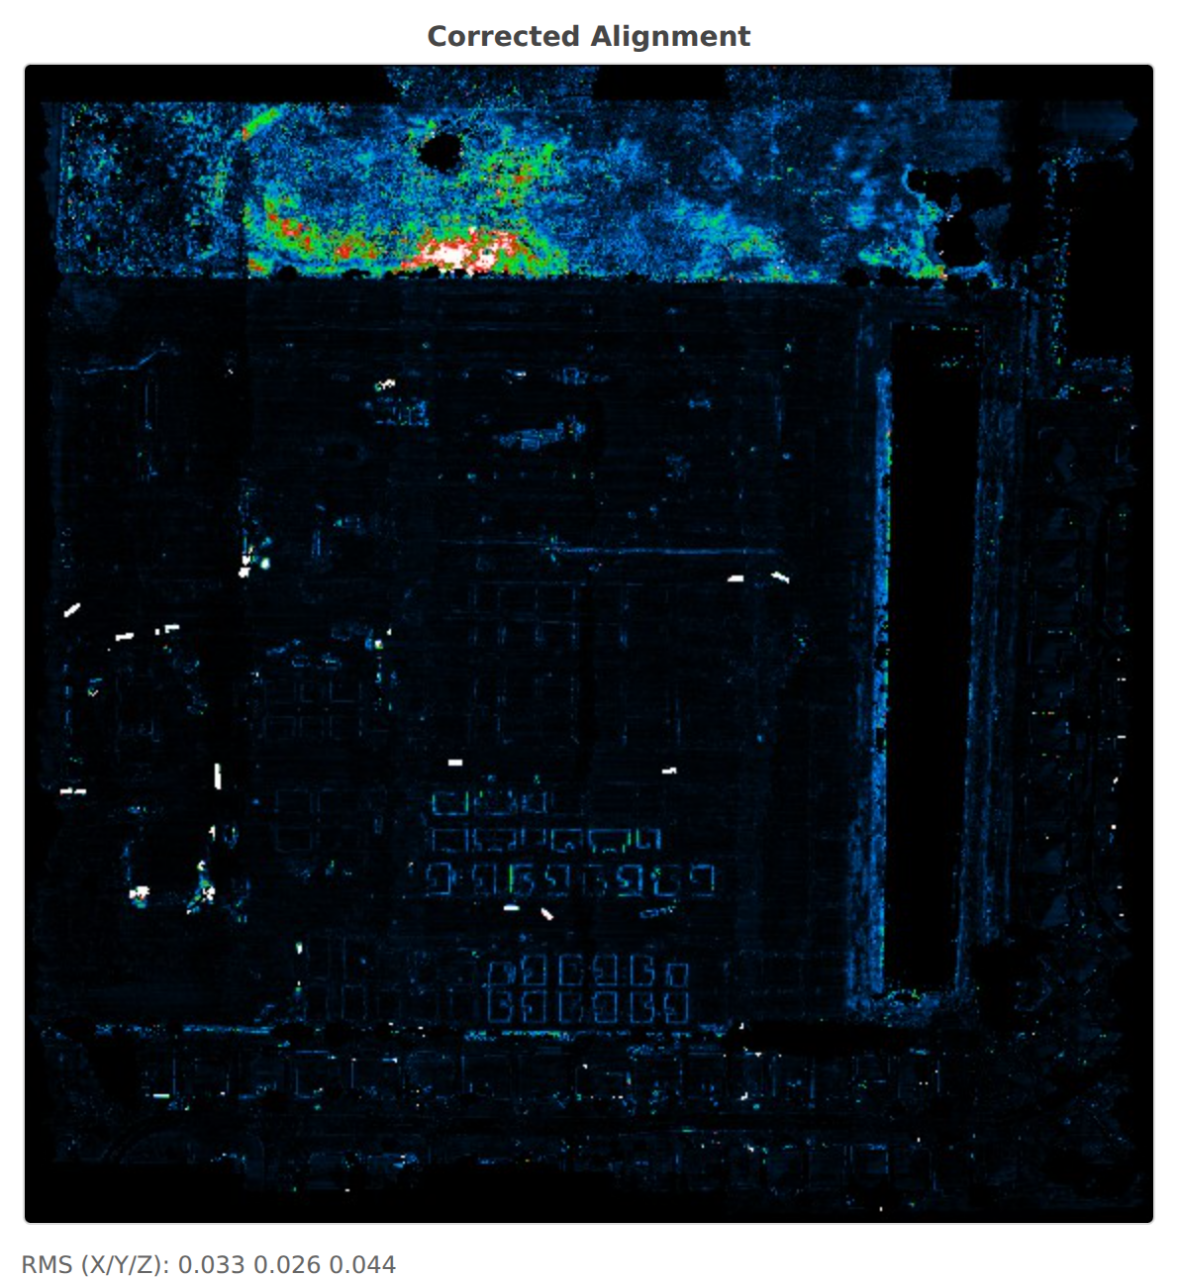
The RMS (X/Y/Z) metric also provides valuable information. The RMS values are expected to be lower in the Corrected Alignment compared to the Original Alignment. If that is not the case, it could indicate an issue in the Strip Alignment process.